class: center, middle, inverse, title-slide # Using R in the Liberal Arts ### Johannes Karreth ### Department of Politics, Ursinus College --- class: inverse, center, middle # Welcome! ### All relevant materials are at <http://www.jkarreth.net/DLA-R.html>. ### Download [`Data.zip`](https://www.dropbox.com/s/r3r493m6fkyjq4k/Data.zip?dl=0) into your WD to follow along with exercises. ### Open the [R script](https://www.dropbox.com/s/dhtqf2xs5h066ff/DLA-R-Script.R?raw=1) in RStudio. --- # Goals for today After this workshop, participants will... - know the capabilities of R as a data analysis tool -- - have seen two use cases for R in action -- - have access to two fully reproducible data analysis examples -- - know where to look for further training & resources --- # Why R?  --- # Build interactive dataviz for students to explore data Classroom application: Morocco's voting record at the UN General Assembly - online at <http://www.jkarreth.net/files/morocco_un-voting.html> --- class: center # Why R? ## Free -- ## Flexible -- ## Failsafe & future-proof (sort of) --- # What can R do for you? R is a popular language & platform for data science & statistical computing. It is: - open source - expanding (increasing capabilities through add-ons) - able to open almost any data format - able to scrape data from the web - a decent tool for data wrangling - popular in industry & academia - pretty old ("born" 1976...) --- # But R also: - is a slightly awkward language for those with programming experience - has a steep learning curve - requires a willingness to write code and use scripts (cf. Tableau & co.) - is less general than Python (but a bit easier to use for advanced statistical computing) --- # Why R in a Liberal Arts setting? - R is **very** versatile; it can be used in a variety of settings (cf. specialized tools for specific purposes) - R is open source and **free** --- # How might you use R? - Create dataviz for teaching - Introduce as a tool for students - Your own research -- **Two use cases today** -- 1. Analyze economic & demographic data - Import data into R - Clean & process the data - Create visualizations -- 2. Analyze social network data - Create and import network data - Create network visualizations & measures --- # Caveat emptor! - The two examples are fairly involved - If you're new to R and/or coding, this may look like overload -- - **But!** This is a good starting point for you. - Everything I'm doing you'll be able to reproduce on your own -- - Things I won't be able to show: + Intro to the R language itself * We don't have the time, so learn by tweaking my code + RMarkdown (using R to produce complete documents or slides) + Text analysis in R * R offers powerful packages! Links at the end of this workshop --- # R is a calculator ```r 1 + 1 ``` ``` ## [1] 2 ``` --- # R is an object-based language ```r students <- 16 papers <- 3 papers_to_grade <- students * papers ``` ```r papers_to_grade ``` ``` ## [1] 48 ``` --- # Try for yourself! How many papers would you have to grade if you were teaching two instead of one section? -- ```r students <- 16 papers <- 3 classes <- 2 papers_to_grade <- students * papers * classes ``` ```r papers_to_grade ``` ``` ## [1] 96 ``` --- # R can be extended by using one of 12,621 packages 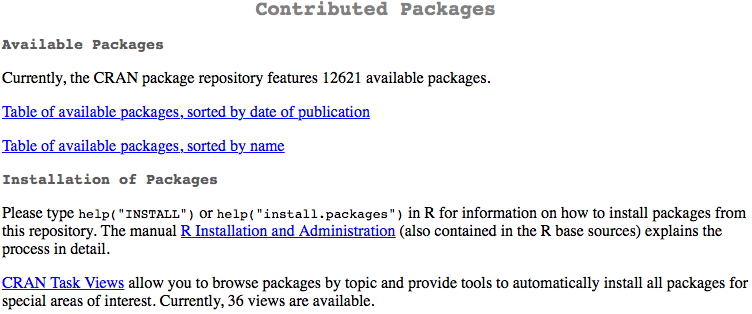 See <https://cran.r-project.org/web/packages/> --- # Install packages *once*, load them *each time* For data input/output: ```r library("rio") help(package = "rio") ``` -- For data processing & graphing: ```r library("tidyverse") help(package = "tidyverse") ``` --- class: inverse, center, middle # Example 1: Data from the CIA World Factbook (2014), prepared by OpenIntro Statistics --- class: center, middle 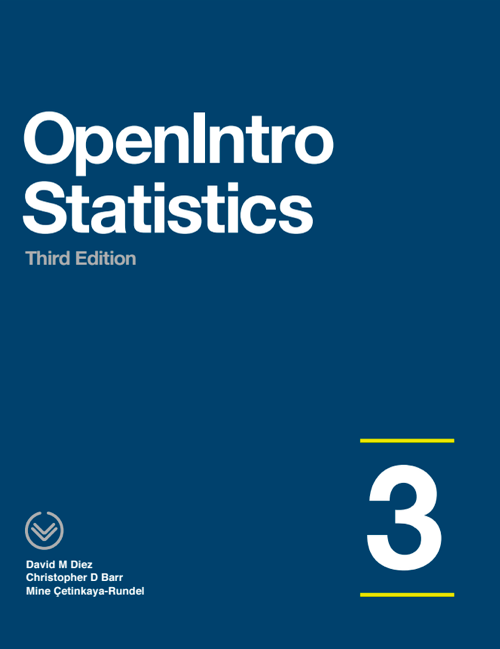 --- # The first two steps 1. Import the data ```r cia <- import("Data/os3_data/Ch 1 Exercise Data/cia_factbook.csv") ``` -- 2. Take a glimpse at the data ```r glimpse(cia) ``` ``` ## Observations: 259 ## Variables: 11 ## $ country <chr> "Russia", "Canada", "United States", "... ## $ area <dbl> 17098242, 9984670, 9826675, 9596960, 8... ## $ birth_rate <dbl> 11.87, 10.29, 13.42, 12.17, 14.72, 12.... ## $ death_rate <dbl> 13.83, 8.31, 8.15, 7.44, 6.54, 7.07, 7... ## $ infant_mortality_rate <dbl> 7.08, 4.71, 6.17, 14.79, 19.21, 4.43, ... ## $ internet_users <dbl> 40853000, 26960000, 245000000, 3890000... ## $ life_exp_at_birth <dbl> 70.16, 81.67, 79.56, 75.15, 73.28, 82.... ## $ maternal_mortality_rate <int> 34, 12, 21, 37, 56, 7, 200, 77, 51, 97... ## $ net_migration_rate <dbl> 1.69, 5.66, 2.45, -0.32, -0.15, 5.74, ... ## $ population <int> 142470272, 34834841, 318892103, 135569... ## $ population_growth_rate <dbl> -0.03, 0.76, 0.77, 0.44, 0.80, 1.09, 1... ``` --- # Try for yourself! View the data in full: ```r View(cia) ``` --- # Life expectancy ```r ggplot(data = cia, aes(x = life_exp_at_birth)) + geom_histogram() ``` <img src="DLA-R-Slides_files/figure-html/unnamed-chunk-11-1.svg" style="display: block; margin: auto;" /> --- # Try for yourself! How is the net migration rate distributed? -- ```r ggplot(data = cia, aes(x = net_migration_rate)) + geom_histogram() ``` <img src="DLA-R-Slides_files/figure-html/unnamed-chunk-12-1.svg" style="display: block; margin: auto;" /> --- # Life expectancy -> more emigration? ```r ggplot(data = cia, aes(x = life_exp_at_birth, y = net_migration_rate)) + geom_point() + geom_text(aes(label = country)) ``` <img src="DLA-R-Slides_files/figure-html/unnamed-chunk-13-1.svg" style="display: block; margin: auto;" /> --- # Let's un-clutter this: ```r filter(cia, net_migration_rate > 20 | net_migration_rate < -20) ``` ``` ## country area birth_rate death_rate ## 1 Zimbabwe 390757 32.47 10.62 ## 2 Syria 185180 22.76 6.51 ## 3 Qatar 11586 9.95 1.53 ## 4 Lebanon 10400 14.80 4.95 ## 5 Micronesia, Federated States of 702 20.97 4.25 ## 6 American Samoa 199 22.87 4.68 ## infant_mortality_rate internet_users life_exp_at_birth ## 1 26.55 1423000 55.68 ## 2 15.79 4469000 68.41 ## 3 6.42 563800 78.38 ## 4 7.98 1000000 77.22 ## 5 21.93 17000 72.35 ## 6 8.92 NA 74.91 ## maternal_mortality_rate net_migration_rate population ## 1 570 21.78 13771721 ## 2 70 -113.51 17951639 ## 3 7 27.35 2123160 ## 4 25 83.82 5882562 ## 5 100 -20.93 105681 ## 6 NA -21.64 54517 ## population_growth_rate ## 1 4.36 ## 2 -9.73 ## 3 3.58 ## 4 9.37 ## 5 -0.42 ## 6 -0.35 ``` --- # Let's un-clutter this: ```r ggplot(data = cia, aes(x = life_exp_at_birth, y = net_migration_rate)) + geom_point() + geom_text(data = filter(cia, net_migration_rate > 20 | net_migration_rate < -20), aes(label = country), vjust = "inward", hjust = "inward") ``` <img src="DLA-R-Slides_files/figure-html/unnamed-chunk-15-1.svg" style="display: block; margin: auto;" /> --- # Are the two variables related? ```r ggplot(data = cia, aes(x = life_exp_at_birth, y = net_migration_rate)) + geom_point() + geom_text(data = filter(cia, net_migration_rate > 20 | net_migration_rate < -20), aes(label = country), vjust = "inward", hjust = "inward") + geom_smooth() ``` <img src="DLA-R-Slides_files/figure-html/unnamed-chunk-16-1.svg" style="display: block; margin: auto;" /> --- # How does internet access vary around the world? I could use `internet_users`, but the raw number is bad for comparison. So let's divide by population: ```r cia <- mutate(cia, internet_users_perc = internet_users / population * 100) ``` --- # How does internet access vary around the world? ```r ggplot(data = cia, aes(x = internet_users_perc)) + geom_histogram() ``` <img src="DLA-R-Slides_files/figure-html/unnamed-chunk-18-1.svg" style="display: block; margin: auto;" /> --- # Higher life expectancy -> more internet access? ```r ggplot(data = cia, aes(x = life_exp_at_birth, y = internet_users_perc)) + geom_point() + geom_smooth() ``` <img src="DLA-R-Slides_files/figure-html/unnamed-chunk-19-1.svg" style="display: block; margin: auto;" /> --- # Let's improve this plot! ```r ggplot(data = cia, aes(x = life_exp_at_birth, y = internet_users_perc)) + geom_point() + geom_smooth() + geom_text(data = filter(cia, internet_users_perc > 90 | life_exp_at_birth > 85), aes(label = country), vjust = "inward", hjust = "inward") + xlab("Life expectancy at birth") + ylab("% of population with internet access") + labs(title = "Countries with higher life expectancy have more internet access", subtitle = "... but this trend applies only to countries with life expectancy of 70 years or higher", caption = "Source: CIA World Factbook") ``` --- # Let's improve this plot! <img src="DLA-R-Slides_files/figure-html/unnamed-chunk-21-1.svg" style="display: block; margin: auto;" /> --- # Try for yourself! How would you plot internet access against population growth (`population_growth_rate`)? -- ```r ggplot(data = cia, aes(x = population_growth_rate, y = internet_users_perc)) + geom_point() + geom_smooth() + xlab("Population growth rate (in percentage points)") + ylab("% of population with internet access") ``` <img src="DLA-R-Slides_files/figure-html/unnamed-chunk-22-1.svg" style="display: block; margin: auto;" /> --- # Identify the outliers ```r filter(cia, population_growth_rate < -5 | population_growth_rate > 5) ``` ``` ## country area birth_rate death_rate infant_mortality_rate ## 1 Syria 185180 22.76 6.51 15.79 ## 2 Lebanon 10400 14.80 4.95 7.98 ## internet_users life_exp_at_birth maternal_mortality_rate ## 1 4469000 68.41 70 ## 2 1000000 77.22 25 ## net_migration_rate population population_growth_rate internet_users_perc ## 1 -113.51 17951639 -9.73 24.89466 ## 2 83.82 5882562 9.37 16.99940 ``` --- # Let's try again, w/o outliers ```r cia_without_outliers <- filter(cia, population_growth_rate > -5 & population_growth_rate < 5) ggplot(data = cia_without_outliers, aes(x = population_growth_rate, y = internet_users_perc)) + geom_point() + geom_smooth() + xlab("Population growth rate (in percentage points)") + ylab("% of population with internet access") ``` <img src="DLA-R-Slides_files/figure-html/unnamed-chunk-24-1.svg" style="display: block; margin: auto;" /> --- # Visualize data on a map First, use the built-in map tools in ggplot2: ```r worldmap <- map_data("world") glimpse(worldmap) ``` ``` ## Observations: 99,338 ## Variables: 6 ## $ long <dbl> -69.89912, -69.89571, -69.94219, -70.00415, -70.0661... ## $ lat <dbl> 12.45200, 12.42300, 12.43853, 12.50049, 12.54697, 12... ## $ group <dbl> 1, 1, 1, 1, 1, 1, 1, 1, 1, 1, 2, 2, 2, 2, 2, 2, 2, 2... ## $ order <int> 1, 2, 3, 4, 5, 6, 7, 8, 9, 10, 12, 13, 14, 15, 16, 1... ## $ region <chr> "Aruba", "Aruba", "Aruba", "Aruba", "Aruba", "Aruba"... ## $ subregion <chr> NA, NA, NA, NA, NA, NA, NA, NA, NA, NA, NA, NA, NA, ... ``` --- # Clean some country names ```r cia <- mutate(cia, country = ifelse(country == "United States", "USA", country)) cia <- mutate(cia, country = ifelse(country == "United Kingdom", "UK", country)) ``` --- # Join CIA and map data ```r iumap <- left_join(x = worldmap, y = cia, by = c("region" = "country")) glimpse(iumap) ``` ``` ## Observations: 99,338 ## Variables: 17 ## $ long <dbl> -69.89912, -69.89571, -69.94219, -70.0... ## $ lat <dbl> 12.45200, 12.42300, 12.43853, 12.50049... ## $ group <dbl> 1, 1, 1, 1, 1, 1, 1, 1, 1, 1, 2, 2, 2,... ## $ order <int> 1, 2, 3, 4, 5, 6, 7, 8, 9, 10, 12, 13,... ## $ region <chr> "Aruba", "Aruba", "Aruba", "Aruba", "A... ## $ subregion <chr> NA, NA, NA, NA, NA, NA, NA, NA, NA, NA... ## $ area <dbl> 180, 180, 180, 180, 180, 180, 180, 180... ## $ birth_rate <dbl> 12.65, 12.65, 12.65, 12.65, 12.65, 12.... ## $ death_rate <dbl> 8.09, 8.09, 8.09, 8.09, 8.09, 8.09, 8.... ## $ infant_mortality_rate <dbl> 11.74, 11.74, 11.74, 11.74, 11.74, 11.... ## $ internet_users <dbl> 24000, 24000, 24000, 24000, 24000, 240... ## $ life_exp_at_birth <dbl> 76.35, 76.35, 76.35, 76.35, 76.35, 76.... ## $ maternal_mortality_rate <int> NA, NA, NA, NA, NA, NA, NA, NA, NA, NA... ## $ net_migration_rate <dbl> 9.04, 9.04, 9.04, 9.04, 9.04, 9.04, 9.... ## $ population <int> 110663, 110663, 110663, 110663, 110663... ## $ population_growth_rate <dbl> 1.36, 1.36, 1.36, 1.36, 1.36, 1.36, 1.... ## $ internet_users_perc <dbl> 21.687466, 21.687466, 21.687466, 21.68... ``` --- # First take: a chloropleth map ```r ggplot(data = iumap, aes(x = long, y = lat, group = group)) + geom_polygon(aes(fill = internet_users_perc)) + labs(title = "Internet usage around the world", subtitle = "% of population with internet access", caption = "Source: CIA World Factbook") ``` <img src="DLA-R-Slides_files/figure-html/unnamed-chunk-28-1.svg" style="display: block; margin: auto;" /> --- # Some improvements - Map projection - Labels - Remove Antarctica - Legend placement ```r worldmap_noant <- filter(worldmap, region != "Antarctica") iumap <- left_join(x = worldmap_noant, y = cia, by = c("region" = "country")) ``` --- # Some improvements - Map projection - Labels - Remove Antarctica - Legend placement <img src="DLA-R-Slides_files/figure-html/unnamed-chunk-30-1.svg" style="display: block; margin: auto;" /> --- # Some improvements - Map projection - Labels - Remove Antarctica - Legend placement ```r ggplot(data = iumap, aes(x = long, y = lat, group = group)) + geom_polygon(aes(fill = life_exp_at_birth)) + labs(title = "Internet usage around the world", subtitle = "% of population with internet access", caption = "Source: CIA World Factbook", fill = "% of population with internet access") + coord_map(projection = "rectangular", lat0 = 0, xlim = c(-180, 180)) + theme(legend.position = "bottom") ``` --- # Try for yourself: Map **migration** rates around the world! -- <img src="DLA-R-Slides_files/figure-html/unnamed-chunk-32-1.svg" style="display: block; margin: auto;" /> --- # Try for yourself: Map migration rates around the world! ```r iumap <- mutate(iumap, net_migration_rate_scaled = plogis(net_migration_rate) - 0.5) ggplot(data = iumap, aes(x = long, y = lat, group = group)) + geom_polygon(aes(fill = net_migration_rate_scaled)) + labs(title = "Migration around the world", subtitle = "Map shows emigration in red and immigration in blue", caption = "Source: CIA World Factbook", fill = "Net migration (logistic transformation)") + coord_map(projection = "rectangular", lat0 = 0, xlim = c(-180, 180)) + theme(legend.position = "bottom") + scale_fill_gradient2(low = "red", mid = "white", high = "blue", midpoint = 0) ``` --- # Adding locations is also easy. Let's pick capitals... First, I scrape location data from the web (using the "rvest" package): Google points me to <http://techslides.com/list-of-countries-and-capitals>... ```r library("rvest") cap_url <- read_html("http://techslides.com/list-of-countries-and-capitals") cap_nodes <- html_nodes(cap_url, "table") cap_table <- html_table(cap_nodes[1], fill = TRUE, header = TRUE)[[1]] glimpse(cap_table) ``` ``` ## Observations: 245 ## Variables: 6 ## $ `Country Name` <chr> "Afghanistan", "Aland Islands", "Albania",... ## $ `Capital Name` <chr> "Kabul", "Mariehamn", "Tirana", "Algiers",... ## $ `Capital Latitude` <dbl> 34.516667, 60.116667, 41.316667, 36.750000... ## $ `Capital Longitude` <dbl> 69.183333, 19.900000, 19.816667, 3.050000,... ## $ `Country Code` <chr> "AF", "AX", "AL", "DZ", "AS", "AD", "AO", ... ## $ `Continent Name` <chr> "Asia", "Europe", "Europe", "Africa", "Aus... ``` --- # Fixing a few country names and removing mini-states ```r cap_table <- mutate(cap_table, `Country Name` = ifelse(`Country Name` == "United States", "USA", `Country Name`)) cap_table <- mutate(cap_table, `Country Name` = ifelse(`Country Name` == "United Kingdom", "UK", `Country Name`)) cia_with_caps <- left_join(x = cia, y = cap_table, by = c("country" = "Country Name")) cia_with_caps <- mutate(cia_with_caps, no_ministates = ifelse(population >= 1000000, 1, 0)) ``` --- # Internet access, with capitals <img src="DLA-R-Slides_files/figure-html/unnamed-chunk-36-1.svg" style="display: block; margin: auto;" /> --- # Internet access, with capitals ```r ggplot(data = iumap, aes(x = long, y = lat, group = group)) + geom_polygon(aes(fill = internet_users_perc)) + geom_point(data = filter(cia_with_caps, no_ministates == 1), aes(x = `Capital Longitude`, y = `Capital Latitude`, group = NULL), color = "orange", size = 1) + labs(title = "Internet usage around the world", subtitle = "% of population with internet access", caption = "Source: CIA World Factbook", fill = "% of population with internet access") + coord_map(projection = "rectangular", lat0 = 0, xlim = c(-180, 180)) + theme(legend.position = "bottom") ``` --- # Instead of building your own... you can use some built-in mapping tools, too! Let's look at some economic data for the tri-state area, using the "blscrapeR" package to pull data from the API of the U.S. Bureau of Labor Statistics. ```r library("blscrapeR") ue_tristate <- get_bls_county(stateName = c("Pennsylvania", "New Jersey", "Delaware")) glimpse(ue_tristate) ``` ``` ## Observations: 91 ## Variables: 10 ## $ area_code <chr> "CN4200100000000", "CN4200300000000", "CN42005... ## $ fips_state <chr> "42", "42", "42", "42", "42", "42", "42", "42"... ## $ fips_county <chr> "001", "003", "005", "007", "009", "011", "013... ## $ area_title <chr> "Adams County, PA", "Allegheny County, PA", "A... ## $ period <date> 2018-04-01, 2018-04-01, 2018-04-01, 2018-04-0... ## $ labor_force <dbl> 54792, 636381, 31909, 83340, 23143, 208953, 58... ## $ employed <dbl> 53218, 612550, 30435, 79786, 22168, 200977, 56... ## $ unemployed <dbl> 1574, 23831, 1474, 3554, 975, 7976, 2251, 1169... ## $ unemployed_rate <dbl> 2.9, 3.7, 4.6, 4.3, 4.2, 3.8, 3.8, 4.1, 3.4, 3... ## $ fips <chr> "42001", "42003", "42005", "42007", "42009", "... ``` --- # Build a map in one step ```r map_bls(map_data = ue_tristate, fill_rate = "unemployed_rate", projection = "lambert", stateName = c("Pennsylvania", "New Jersey", "Delaware"), labtitle = "Unemployment rate in the Tri-State Area") ``` <img src="DLA-R-Slides_files/figure-html/unnamed-chunk-39-1.svg" style="display: block; margin: auto;" /> --- # Adapt for colorblind audience The "viridis" package comes in handy here: ```r library("viridis") map_bls(map_data = ue_tristate, fill_rate = "unemployed_rate", projection = "lambert", stateName = c("Pennsylvania", "New Jersey", "Delaware"), labtitle = "Unemployment rate in the Tri-State Area") + scale_fill_viridis(option = "plasma") ``` --- # Adapt for colorblind audience The "viridis" package comes in handy here: <img src="DLA-R-Slides_files/figure-html/unnamed-chunk-41-1.svg" style="display: block; margin: auto;" /> --- # Example 2: #oscarssowhite What do we know about diversity among Academy Award winners over time? I use data provided by Crowdflower/FigureEight: <https://data.world/crowdflower/academy-awards-demographics> ```r aa <- import("Data/crowdflower-academy-awards-demographics/data/oscars_demographics_dfe.csv") glimpse(aa) ``` ``` ## Observations: 441 ## Variables: 27 ## $ unit_id <int> 670454353, 670454354, 670454355,... ## $ golden <chr> "false", "false", "false", "fals... ## $ unit_state <chr> "finalized", "finalized", "final... ## $ trusted_judgments <int> 3, 3, 3, 3, 3, 3, 3, 3, 3, 3, 3,... ## $ last_judgment_at <chr> "2015-02-10T03:45:00", "2015-02-... ## $ birthplace <chr> "Chisinau, Moldova", "Glasgow, S... ## $ birthplace_confidence <dbl> 1.0000, 1.0000, 1.0000, 1.0000, ... ## $ date_of_birth <chr> "30-Sep-1895", "2-Feb-1886", "30... ## $ date_of_birth_confidence <dbl> 1, 1, 1, 1, 1, 1, 1, 1, 1, 1, 1,... ## $ race_ethnicity <chr> "White", "White", "White", "Whit... ## $ race_ethnicity_confidence <dbl> 1, 1, 1, 1, 1, 1, 1, 1, 1, 1, 1,... ## $ religion <chr> "Na", "Na", "Na", "Na", "Roman C... ## $ religion_confidence <dbl> 1, 1, 1, 1, 1, 1, 1, 1, 1, 1, 1,... ## $ sexual_orientation <chr> "Straight", "Straight", "Straigh... ## $ sexual_orientation_confidence <dbl> 1.0000, 0.6842, 1.0000, 1.0000, ... ## $ year_of_award <int> 1927, 1930, 1931, 1932, 1933, 19... ## $ year_of_award_confidence <dbl> 1.0000, 1.0000, 0.6667, 1.0000, ... ## $ award <chr> "Best Director", "Best Director"... ## $ biourl <chr> "http://www.nndb.com/people/320/... ## $ birthplace_gold <chr> "", "", "", "", "", "", "", "", ... ## $ date_of_birth_gold <chr> "", "", "", "", "", "", "", "", ... ## $ movie <chr> "Two Arabian Knights", "The Divi... ## $ person <chr> "Lewis Milestone", "Frank Lloyd"... ## $ race_ethnicity_gold <chr> "", "", "", "", "", "", "", "", ... ## $ religion_gold <chr> "", "", "", "", "", "", "", "", ... ## $ sexual_orientation_gold <chr> "", "", "", "", "", "", "", "", ... ## $ year_of_award_gold <int> NA, NA, NA, NA, NA, NA, NA, NA, ... ``` --- # Which awards are in the dataset? ```r table(aa$award) ``` ``` ## ## Best Actor Best Actress Best Director ## 88 95 91 ## Best Supporting Actor Best Supporting Actress ## 82 85 ``` --- # AA winners overall ```r ggplot(data = aa, aes(x = race_ethnicity)) + geom_bar() ``` <img src="DLA-R-Slides_files/figure-html/unnamed-chunk-44-1.svg" style="display: block; margin: auto;" /> --- # AA winners over time First, collapse the data: ```r aa_year <- summarize(group_by(aa, year_of_award, race_ethnicity), awards = n()) ``` --- # AA winners over time Then, create the plot: ```r ggplot(data = aa_year, aes(x = year_of_award, y = awards, color = race_ethnicity)) + geom_point() + ylim(0, NA) ``` <img src="DLA-R-Slides_files/figure-html/unnamed-chunk-46-1.svg" style="display: block; margin: auto;" /> --- # More recent trends since 1960 ```r ggplot(data = filter(aa_year, year_of_award >= 1960), aes(x = year_of_award, y = awards, fill = race_ethnicity)) + geom_col() + ylim(0, NA) + scale_fill_viridis(discrete = TRUE) ``` <img src="DLA-R-Slides_files/figure-html/unnamed-chunk-47-1.svg" style="display: block; margin: auto;" /> --- class: inverse, center, middle # Example 3: Network analysis!  --- class:center # What do network data look like? --- # Nodes (vertices, individuals, ...) ```r sw_nodes <- import("Data/Star Wars/star-wars-network-nodes.csv") head(sw_nodes) ``` ``` ## name id ## 1 R2-D2 0 ## 2 CHEWBACCA 1 ## 3 C-3PO 2 ## 4 LUKE 3 ## 5 DARTH VADER 4 ## 6 CAMIE 5 ``` --- # Edges (links, connections, ties, ...) ```r sw_links <- import("Data/Star Wars/star-wars-network-edges.csv") head(sw_links) ``` ``` ## source target weight ## 1 C-3PO R2-D2 17 ## 2 LUKE R2-D2 13 ## 3 OBI-WAN R2-D2 6 ## 4 LEIA R2-D2 5 ## 5 HAN R2-D2 5 ## 6 CHEWBACCA R2-D2 3 ``` --- # You can start with nodes and edges... and then have R build the network for you. ```r library("igraph") sw_net <- graph_from_data_frame(d = sw_links, vertices = sw_nodes, directed = FALSE) sw_net ``` ``` ## IGRAPH 1718aae UNW- 22 60 -- ## + attr: name (v/c), id (v/n), weight (e/n) ## + edges from 1718aae (vertex names): ## [1] R2-D2 --C-3PO R2-D2 --LUKE ## [3] R2-D2 --OBI-WAN R2-D2 --LEIA ## [5] R2-D2 --HAN R2-D2 --CHEWBACCA ## [7] R2-D2 --DODONNA CHEWBACCA --OBI-WAN ## [9] CHEWBACCA --C-3PO CHEWBACCA --LUKE ## [11] CHEWBACCA --HAN CHEWBACCA --LEIA ## [13] CHEWBACCA --DARTH VADER CHEWBACCA --DODONNA ## [15] LUKE --CAMIE CAMIE --BIGGS ## + ... omitted several edges ``` --- # A first look at the network ```r plot(sw_net) ``` <img src="DLA-R-Slides_files/figure-html/unnamed-chunk-51-1.svg" style="display: block; margin: auto;" /> --- # Optimize the network display - Colors - Font - Edge width - Node size -- <img src="DLA-R-Slides_files/figure-html/unnamed-chunk-52-1.svg" style="display: block; margin: auto;" /> --- # Optimize the network display ```r V(sw_net)$size <- log(strength(sw_net)) * 2 * 2 E(sw_net)$width <- E(sw_net)$weight / 2 plot(sw_net, edge.arrow.size = .2, edge.curved =.25, edge.color = "lightblue", vertex.color = "orange", vertex.frame.color = "white", vertex.label.cex = .75, vertex.label.color = "black", vertex.label.family = "Helvetica") ``` --- # A different network layout <img src="DLA-R-Slides_files/figure-html/unnamed-chunk-54-1.svg" style="display: block; margin: auto;" /> --- # A different network layout ```r plot(sw_net, edge.arrow.size = .2, edge.curved =.25, edge.color = "lightblue", vertex.color = "orange", vertex.frame.color = "white", vertex.label.cex = .75, vertex.label.color = "black", vertex.label.family = "Helvetica", layout = layout_in_circle) ``` --- # Create a dynamic visualization with the "visNetwork" package ```r library("visNetwork") visNetwork(sw_nodes, sw_links, width = "100%", height = "400px") ``` <div id="htmlwidget-0b6299e349a5f8eea517" style="width:100%;height:400px;" class="visNetwork html-widget"></div> <script type="application/json" data-for="htmlwidget-0b6299e349a5f8eea517">{"x":{"nodes":{"name":["R2-D2","CHEWBACCA","C-3PO","LUKE","DARTH VADER","CAMIE","BIGGS","LEIA","BERU","OWEN","OBI-WAN","MOTTI","TARKIN","HAN","GREEDO","JABBA","DODONNA","GOLD LEADER","WEDGE","RED LEADER","RED TEN","GOLD FIVE"],"id":[0,1,2,3,4,5,6,7,8,9,10,11,12,13,14,15,16,17,18,19,20,21]},"edges":{"source":["C-3PO","LUKE","OBI-WAN","LEIA","HAN","CHEWBACCA","DODONNA","CHEWBACCA","C-3PO","CHEWBACCA","CHEWBACCA","CHEWBACCA","CHEWBACCA","CHEWBACCA","CAMIE","BIGGS","BIGGS","DARTH VADER","BERU","BERU","BERU","LUKE","C-3PO","C-3PO","C-3PO","LEIA","BERU","LUKE","C-3PO","LEIA","MOTTI","DARTH VADER","DARTH VADER","HAN","HAN","GREEDO","HAN","C-3PO","LEIA","LEIA","HAN","DARTH VADER","DODONNA","DODONNA","DODONNA","GOLD LEADER","GOLD LEADER","LUKE","BIGGS","LEIA","LUKE","BIGGS","BIGGS","C-3PO","RED LEADER","GOLD LEADER","BIGGS","RED LEADER","BIGGS","LUKE"],"target":["R2-D2","R2-D2","R2-D2","R2-D2","R2-D2","R2-D2","R2-D2","OBI-WAN","CHEWBACCA","LUKE","HAN","LEIA","DARTH VADER","DODONNA","LUKE","CAMIE","LUKE","LEIA","LUKE","OWEN","C-3PO","OWEN","LUKE","OWEN","LEIA","LUKE","LEIA","OBI-WAN","OBI-WAN","OBI-WAN","TARKIN","MOTTI","TARKIN","OBI-WAN","LUKE","HAN","JABBA","HAN","MOTTI","TARKIN","LEIA","OBI-WAN","GOLD LEADER","WEDGE","LUKE","WEDGE","LUKE","WEDGE","LEIA","RED LEADER","RED LEADER","RED LEADER","C-3PO","RED LEADER","WEDGE","RED LEADER","WEDGE","RED TEN","GOLD LEADER","RED TEN"],"weight":[17,13,6,5,5,3,1,7,5,16,19,11,1,1,2,2,4,1,3,3,2,3,18,2,6,17,1,19,6,1,2,1,7,9,26,1,1,6,1,1,13,1,1,1,1,1,1,2,1,1,3,3,1,1,3,1,2,1,1,1]},"nodesToDataframe":true,"edgesToDataframe":true,"options":{"width":"100%","height":"100%","nodes":{"shape":"dot"},"manipulation":{"enabled":false}},"groups":null,"width":"100%","height":"400px","idselection":{"enabled":false},"byselection":{"enabled":false},"main":null,"submain":null,"footer":null,"background":"rgba(0, 0, 0, 0)"},"evals":[],"jsHooks":[]}</script> --- # Optimize display ```r sw_from <- left_join(x = sw_links, y = select(sw_nodes, name, id), by = c("source" = "name")) sw_from <- rename(sw_from, from = id) sw_to <- left_join(x = sw_from, y = select(sw_nodes, name, id), by = c("target" = "name")) sw_to <- rename(sw_to, to = id) sw_links <- sw_to sw_nodes$label <- sw_nodes$name sw_nodes$shape <- "dot" sw_nodes$shadow <- TRUE # Nodes will drop shadow sw_nodes$borderWidth <- 2 # Node border width sw_nodes$color.background <- "orange" sw_nodes$color.border <- "darkred" sw_nodes$color.highlight.background <- "darkred" sw_nodes$color.highlight.border <- "orange" sw_nodes$size <- strength(sw_net) / 5 sw_links$width <- sw_links$weight / 2 sw_links$color <- "lightblue" ``` --- # The result (Move to R for full effect) ```r library("visNetwork") visNetwork(sw_nodes, sw_links) ``` <div id="htmlwidget-cc710b390788ea7bb88f" style="width:100%;height:432px;" class="visNetwork html-widget"></div> <script type="application/json" data-for="htmlwidget-cc710b390788ea7bb88f">{"x":{"nodes":{"name":["R2-D2","CHEWBACCA","C-3PO","LUKE","DARTH VADER","CAMIE","BIGGS","LEIA","BERU","OWEN","OBI-WAN","MOTTI","TARKIN","HAN","GREEDO","JABBA","DODONNA","GOLD LEADER","WEDGE","RED LEADER","RED TEN","GOLD FIVE"],"id":[0,1,2,3,4,5,6,7,8,9,10,11,12,13,14,15,16,17,18,19,20,21],"label":["R2-D2","CHEWBACCA","C-3PO","LUKE","DARTH VADER","CAMIE","BIGGS","LEIA","BERU","OWEN","OBI-WAN","MOTTI","TARKIN","HAN","GREEDO","JABBA","DODONNA","GOLD LEADER","WEDGE","RED LEADER","RED TEN","GOLD FIVE"],"shape":["dot","dot","dot","dot","dot","dot","dot","dot","dot","dot","dot","dot","dot","dot","dot","dot","dot","dot","dot","dot","dot","dot"],"shadow":[true,true,true,true,true,true,true,true,true,true,true,true,true,true,true,true,true,true,true,true,true,true],"borderWidth":[2,2,2,2,2,2,2,2,2,2,2,2,2,2,2,2,2,2,2,2,2,2],"color.background":["orange","orange","orange","orange","orange","orange","orange","orange","orange","orange","orange","orange","orange","orange","orange","orange","orange","orange","orange","orange","orange","orange"],"color.border":["darkred","darkred","darkred","darkred","darkred","darkred","darkred","darkred","darkred","darkred","darkred","darkred","darkred","darkred","darkred","darkred","darkred","darkred","darkred","darkred","darkred","darkred"],"color.highlight.background":["darkred","darkred","darkred","darkred","darkred","darkred","darkred","darkred","darkred","darkred","darkred","darkred","darkred","darkred","darkred","darkred","darkred","darkred","darkred","darkred","darkred","darkred"],"color.highlight.border":["orange","orange","orange","orange","orange","orange","orange","orange","orange","orange","orange","orange","orange","orange","orange","orange","orange","orange","orange","orange","orange","orange"],"size":[10,12.6,12.8,25.8,2.2,0.8,2.8,11.8,1.8,1.6,9.8,0.8,2,16,0.2,0.2,1,1,1.8,2.6,0.4,0]},"edges":{"source":["C-3PO","LUKE","OBI-WAN","LEIA","HAN","CHEWBACCA","DODONNA","CHEWBACCA","C-3PO","CHEWBACCA","CHEWBACCA","CHEWBACCA","CHEWBACCA","CHEWBACCA","CAMIE","BIGGS","BIGGS","DARTH VADER","BERU","BERU","BERU","LUKE","C-3PO","C-3PO","C-3PO","LEIA","BERU","LUKE","C-3PO","LEIA","MOTTI","DARTH VADER","DARTH VADER","HAN","HAN","GREEDO","HAN","C-3PO","LEIA","LEIA","HAN","DARTH VADER","DODONNA","DODONNA","DODONNA","GOLD LEADER","GOLD LEADER","LUKE","BIGGS","LEIA","LUKE","BIGGS","BIGGS","C-3PO","RED LEADER","GOLD LEADER","BIGGS","RED LEADER","BIGGS","LUKE"],"target":["R2-D2","R2-D2","R2-D2","R2-D2","R2-D2","R2-D2","R2-D2","OBI-WAN","CHEWBACCA","LUKE","HAN","LEIA","DARTH VADER","DODONNA","LUKE","CAMIE","LUKE","LEIA","LUKE","OWEN","C-3PO","OWEN","LUKE","OWEN","LEIA","LUKE","LEIA","OBI-WAN","OBI-WAN","OBI-WAN","TARKIN","MOTTI","TARKIN","OBI-WAN","LUKE","HAN","JABBA","HAN","MOTTI","TARKIN","LEIA","OBI-WAN","GOLD LEADER","WEDGE","LUKE","WEDGE","LUKE","WEDGE","LEIA","RED LEADER","RED LEADER","RED LEADER","C-3PO","RED LEADER","WEDGE","RED LEADER","WEDGE","RED TEN","GOLD LEADER","RED TEN"],"weight":[17,13,6,5,5,3,1,7,5,16,19,11,1,1,2,2,4,1,3,3,2,3,18,2,6,17,1,19,6,1,2,1,7,9,26,1,1,6,1,1,13,1,1,1,1,1,1,2,1,1,3,3,1,1,3,1,2,1,1,1],"from":[2,3,10,7,13,1,16,1,2,1,1,1,1,1,5,6,6,4,8,8,8,3,2,2,2,7,8,3,2,7,11,4,4,13,13,14,13,2,7,7,13,4,16,16,16,17,17,3,6,7,3,6,6,2,19,17,6,19,6,3],"to":[0,0,0,0,0,0,0,10,1,3,13,7,4,16,3,5,3,7,3,9,2,9,3,9,7,3,7,10,10,10,12,11,12,10,3,13,15,13,11,12,7,10,17,18,3,18,3,18,7,19,19,19,2,19,18,19,18,20,17,20],"width":[8.5,6.5,3,2.5,2.5,1.5,0.5,3.5,2.5,8,9.5,5.5,0.5,0.5,1,1,2,0.5,1.5,1.5,1,1.5,9,1,3,8.5,0.5,9.5,3,0.5,1,0.5,3.5,4.5,13,0.5,0.5,3,0.5,0.5,6.5,0.5,0.5,0.5,0.5,0.5,0.5,1,0.5,0.5,1.5,1.5,0.5,0.5,1.5,0.5,1,0.5,0.5,0.5],"color":["lightblue","lightblue","lightblue","lightblue","lightblue","lightblue","lightblue","lightblue","lightblue","lightblue","lightblue","lightblue","lightblue","lightblue","lightblue","lightblue","lightblue","lightblue","lightblue","lightblue","lightblue","lightblue","lightblue","lightblue","lightblue","lightblue","lightblue","lightblue","lightblue","lightblue","lightblue","lightblue","lightblue","lightblue","lightblue","lightblue","lightblue","lightblue","lightblue","lightblue","lightblue","lightblue","lightblue","lightblue","lightblue","lightblue","lightblue","lightblue","lightblue","lightblue","lightblue","lightblue","lightblue","lightblue","lightblue","lightblue","lightblue","lightblue","lightblue","lightblue"]},"nodesToDataframe":true,"edgesToDataframe":true,"options":{"width":"100%","height":"100%","nodes":{"shape":"dot"},"manipulation":{"enabled":false}},"groups":null,"width":null,"height":null,"idselection":{"enabled":false},"byselection":{"enabled":false},"main":null,"submain":null,"footer":null,"background":"rgba(0, 0, 0, 0)"},"evals":[],"jsHooks":[]}</script> --- # Some less flashy descriptives Degree centrality (number of ties of a node) ```r sort(degree(sw_net)) ``` ``` ## GOLD FIVE GREEDO JABBA CAMIE RED TEN OWEN ## 0 1 1 2 2 3 ## MOTTI TARKIN BERU DARTH VADER DODONNA GOLD LEADER ## 3 3 4 5 5 5 ## WEDGE R2-D2 BIGGS OBI-WAN RED LEADER CHEWBACCA ## 5 7 7 7 7 8 ## HAN C-3PO LEIA LUKE ## 8 10 12 15 ``` --- # Some less flashy descriptives Betweenness centrality (the number of times a node acts as a bridge along the shortest path between two other nodes) ```r sort(betweenness(sw_net)) ``` ``` ## CAMIE OWEN OBI-WAN MOTTI TARKIN GREEDO ## 0.000000 0.000000 0.000000 0.000000 0.000000 0.000000 ## JABBA WEDGE GOLD FIVE BERU RED TEN DARTH VADER ## 0.000000 0.000000 0.000000 1.666667 2.200000 15.583333 ## CHEWBACCA LUKE R2-D2 GOLD LEADER RED LEADER BIGGS ## 15.916667 18.333333 22.750000 23.800000 31.416667 31.916667 ## C-3PO HAN DODONNA LEIA ## 32.783333 37.000000 47.533333 59.950000 ``` --- # Community detection ```r giant <- decompose(sw_net)[[1]] comm <- cluster_infomap(giant) modularity(comm) ``` ``` ## [1] 0.06420569 ``` (High modularity [-1, 1] indicates a highly clustered network.) --- # Community detection ```r plot(comm, giant) ``` <img src="DLA-R-Slides_files/figure-html/unnamed-chunk-62-1.svg" style="display: block; margin: auto;" /> --- # Community detection, different viz ```r V(giant)$color <- membership(comm) plot(giant) ``` <img src="DLA-R-Slides_files/figure-html/unnamed-chunk-63-1.svg" style="display: block; margin: auto;" /> --- class: inverse, center, middle # Hands-on exercise --- # Put your own data to work 1. Pull up or create your own data 2. Import it into R 3. Create a basic visualization following the examples you've just seen --- class: inverse # That's it for today! **Thank you for staying around!** What I didn't show: - Basics of the R language itself -- - RMarkdown & R Notebooks -- - Other applications + Text mining + Statistics + Machine learning & pattern detection + Check CRAN task views for your area of interest --- class: inverse # More resources Take a look at <http://www.jkarreth.net/DLA-R.html> - Further resources are linked on my website (link above) - Workflow for data analysis using R: check out [Project TIER](https://www.projecttier.org) (Teaching Integrity in Empirical Research) @ Haverford * Look for a demo project (in R) & exercises soon - Troubleshooting & code examples * Stackoverflow/R - Workshops in the area: [PhillyR](https://www.meetup.com/PhillyR), [R-Ladies Philly](https://www.meetup.com/rladies-philly/) Please don't hesitate to follow up at <jkarreth@ursinus.edu>! (These slides were created via the R package [xaringan](https://github.com/yihui/xaringan).) Credits: - OpenIntro Statistics, an open-source textbook for introductory statistics - The vignette of the blscrapeR package - Katya Ognyanova's excellent PolNet tutorial - Pablo Barbera's Star Wars data